
When a Fusion architect looks at an agentic app, the first questions are usually about tables and REST services. Those are reasonable questions for almost everything else Oracle has put into Fusion. Here, however, the answer is different.
An agentic app does not have its own tables, views, business objects or REST APIs. Its workflow agent provides the backend behaviour. I spent three days building against this model during Oracle’s partner enablement in August. My earlier article, Inside an Oracle Fusion Agentic App, described the app in the terms used by the documentation. This article looks at the execution underneath it, the design consequences and the console command that lets you observe it directly.
Quick Summary
The app has no separate data layer. It does not have tables, a business object layer or a REST API layer of its own; the workflow agent fills that role. This was stated in the sessions, rather than in a published source I can cite.
A single label routes each request. The app includes
{{$context.$app.$OraMessageHint}}on every call. The workflow’s first substantive node is a Switch that reads it. The published set contains ten hints, withInvokeCapabilityadded in 26C.Each invocation begins at the top of the workflow. Business object outputs do not persist between hints, conversation-scoped variables do not survive, and each hint arrives as a fresh session. I observed this in three different ways during the labs, but it remains on my re-verification list.
The browser-console command
turnOnDebugging()shows the load sequence. It logs the hint type, the duration for each hint and each contributing agent’sPartial Summarybefore the “Oracle AI Apps Orchestrator” combines them. The command appears in Oracle’s Public lab guide, so this is not simply a trick demonstrated on a slide.The number of sections affects latency and cost. Every contributing agent runs when the app loads. Trainers gave six or seven as the practical ceiling.
Three settings determine whether an agent works in the app. If the agent is missing from the builder dropdown, or returns plain text instead of a widget, one of those prerequisites is usually the cause.
Read on for the full breakdown.
The Workflow Agent Provides the Behaviour
When an agentic app calls an agent, it passes a label in {{$context.$app.$OraMessageHint}}. The label tells the workflow what kind of response the app expects.
The lab guide describes a hint as a label sent by the application to a workflow agent to identify the purpose of the request and the expected response. Oracle’s Fusion CoE article, Agentic Apps - Message Hints, lists every hint and its trigger, so I will not repeat the table here.
The first real node in the workflow is a Switch on the hint value. Each branch gives the same agent a different job. Summary produces the strapline, InitDisplay builds the widgets and Query answers a typed question. The workflow therefore has one agent, ten entry points and one label that selects the entry point.
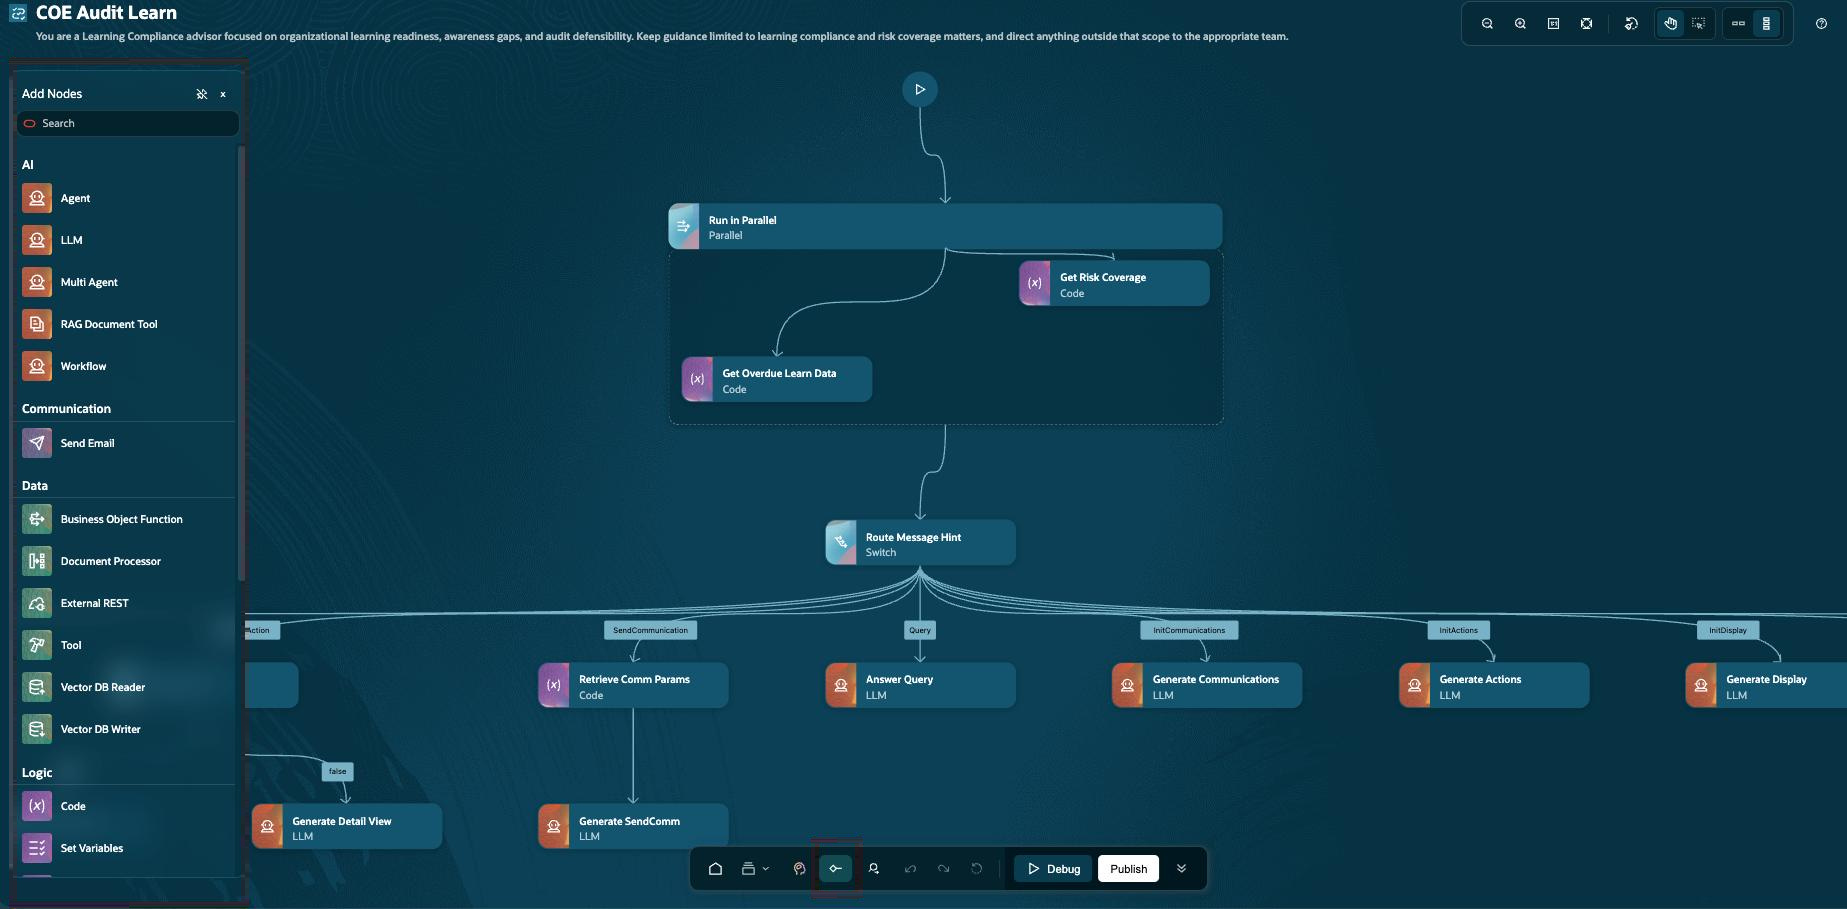
This changes the data-model discussion with a client. Anything that touches Fusion data lives inside a workflow branch and runs there under the requesting user's security. The useful architecture questions are which operations each agent may perform and on whose behalf.
Each Call Starts Again
The detail that catches people is that the workflow retains no state between these calls. Every call enters at the top and evaluates the Switch again.
The session phrasing was that every single time the app calls a workflow, it starts from the top. The Day 2 labs approached this from three directions. A business object output fetched for one hint was unavailable to the next. Conversation-scoped variables did not survive. Each hint behaved like a new session. The behaviour was consistent, but I saw it in a training pod rather than in a documented guarantee. I am reproducing it in my own environment before presenting it to a client as a firm constraint.
If the behaviour holds, it has three practical consequences:
Keep business object calls inside the relevant hint branches and expect some repetition. If both
InitDisplayandQueryneed a worker’s assignment record, each branch fetches it. There is no shared cache, and a common node placed before the Switch would run for every hint, including those that do not need the data.Carry the required context in the payload. An action must receive what it needs in the request or fetch it within its own branch. An action that relies on a value calculated by the display branch thirty seconds earlier may appear to work in a demo and fail on the next click.
Only the
Querybranch receives conversational memory, and it receives that memory with the request. WhenInclude chat historyis enabled, the conversation is handed to the node on each call. The workflow itself still retains nothing. The rest of the app is answering ten distinct requests about one screen, rather than maintaining a conversation.
This design isolates the ten call types from one another: a failure in one region cannot corrupt state used by another. The cost is repeated data retrieval, which needs to be included in the design and estimate.
Observing the Sequence With turnOnDebugging()
Open an agentic app, open the browser console, enter turnOnDebugging() and press Enter. The console responds with “Agentic Apps debug mode enabled”. Refresh the page and it logs every agent response as it arrives, including the hint type and elapsed time. Oracle documents this in steps 21 to 23 of its Lab 1 guide, which is marked Public on every page.
With debugging enabled, a refresh shows the five startup hints. Filter the console for “Summary” and you can see the consolidation: each contributing agent returns a Partial Summary, after which the “Oracle AI Apps Orchestrator” combines them into the summary displayed in the app. What looks like a single paragraph in the interface is produced by a fan-out and merge.
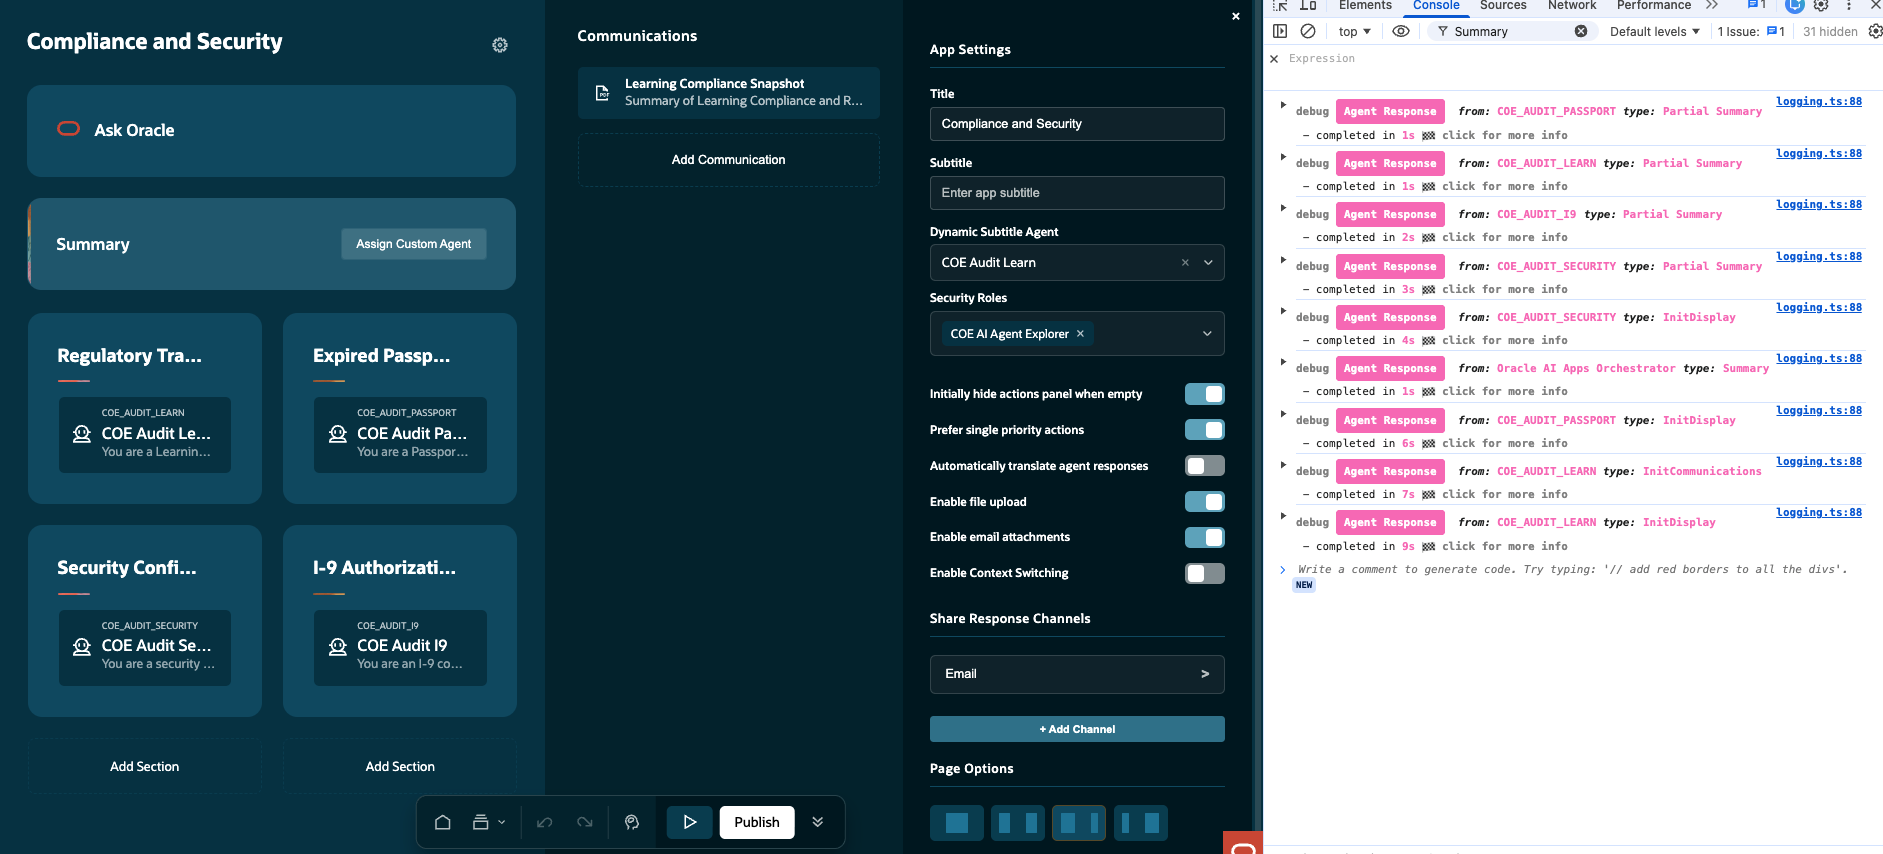
The log contains more than hint responses. [ora.app] Saving application metadata prints the app configuration, including its pagePattern. The session app used swimlanesPattern, which shows that layout belongs to app metadata rather than to an individual agent.
If an app feels slow, these per-hint timings let you identify the agent responsible. There is an important handling point: the console output includes agent codes and a configuration dump. I would use it only in my own demo pod, never in a client’s environment or in a screenshot taken from one.
Why Section Count Matters
On load, every section configured to contribute to the summary receives a Summary hint and runs its agent. The session did not give a technical limit on the number of sections or agents in an app. It did give a practical ceiling of six or seven, because additional sections increase both load latency and AI Units consumed on every open. A 300-node workflow was offered as the example to avoid.
This makes section count part of the cost model:
A section does not necessarily need to contribute to the summary. Removing that branch, or using a dedicated summary agent, removes one call from every load rather than from a single screen.
The load-time cost applies on every open. An eighth section that is useful once a week still runs for every user on every load.
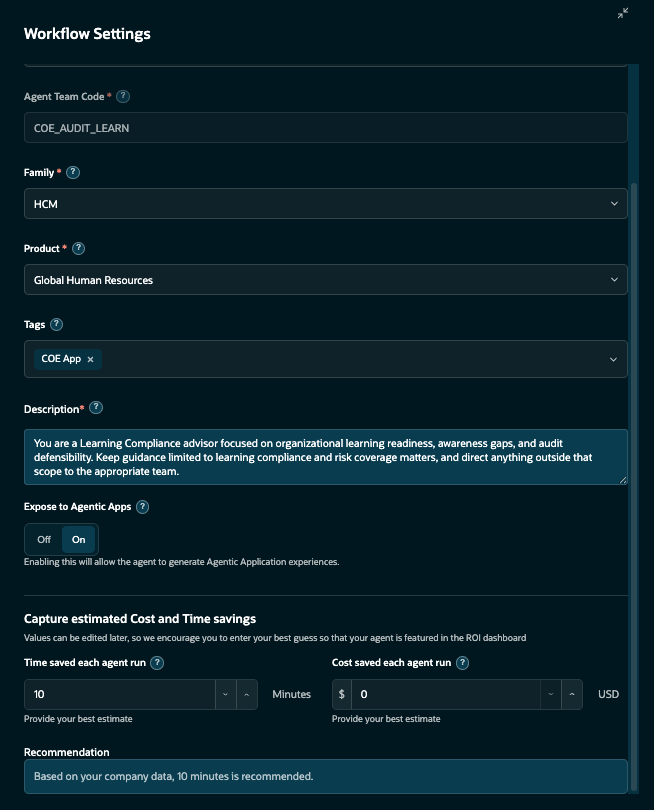
Workflow Settings contains useful estimate fields. Beside the exposure flag are fields for estimated cost and time saved per run, in dollars and minutes. They are underused, but they provide the figures a steering committee is likely to request.
I would not cite six or seven as a documented limit, because it is not one. The mechanism is the defensible point: each contributing section triggers a call on each load, and the console shows those calls.
The Three Prerequisites
A common failure during the training was an agent that did not appear in the app builder’s dropdown. The trainers gave three checks, in this order:
Enable
Expose to Agentic Appsin Workflow Settings. Without it, the app-experience properties do not appear on the LLM nodes, so the agent has nothing to render even if it could be selected.Publish the agent at least once. A draft-only agent is absent from the builder. This catches teams that iterate quickly but have never completed an initial publication.
End every branch on an LLM node. Widget, action and communication properties exist only on that leaf node. A branch that ends with a code node and a return node can still return plain text, making the agent appear functional until the app needs a chart.
The third issue can consume an afternoon because it produces no error. When an agent behaves unexpectedly in the builder, I work through these checks in order.
Run Profiles and a Deliberately Broken Node
The most frequent complaint in the room was the iteration loop: edit the workflow, publish it, return to the app, refresh and inspect. There are two ways to shorten it.
One is useDraftWorkflowWhileDeveloping in the app JSON. An agent has only two versions at a time, draft and published, and this setting directs the app to the draft while you work.
The more capable option is a run profile in the workflow debugger. Set the trigger type to Agentic App, then choose Initial Display to inspect the rendered result or Invoke Action to supply a payload in the form the app sends. In my lab, that payload was ScheduleCheckin, ScheduleCheckin(101). You can use breakpoints, Step, Resume, Rerun From Node and input overrides without leaving the editor.
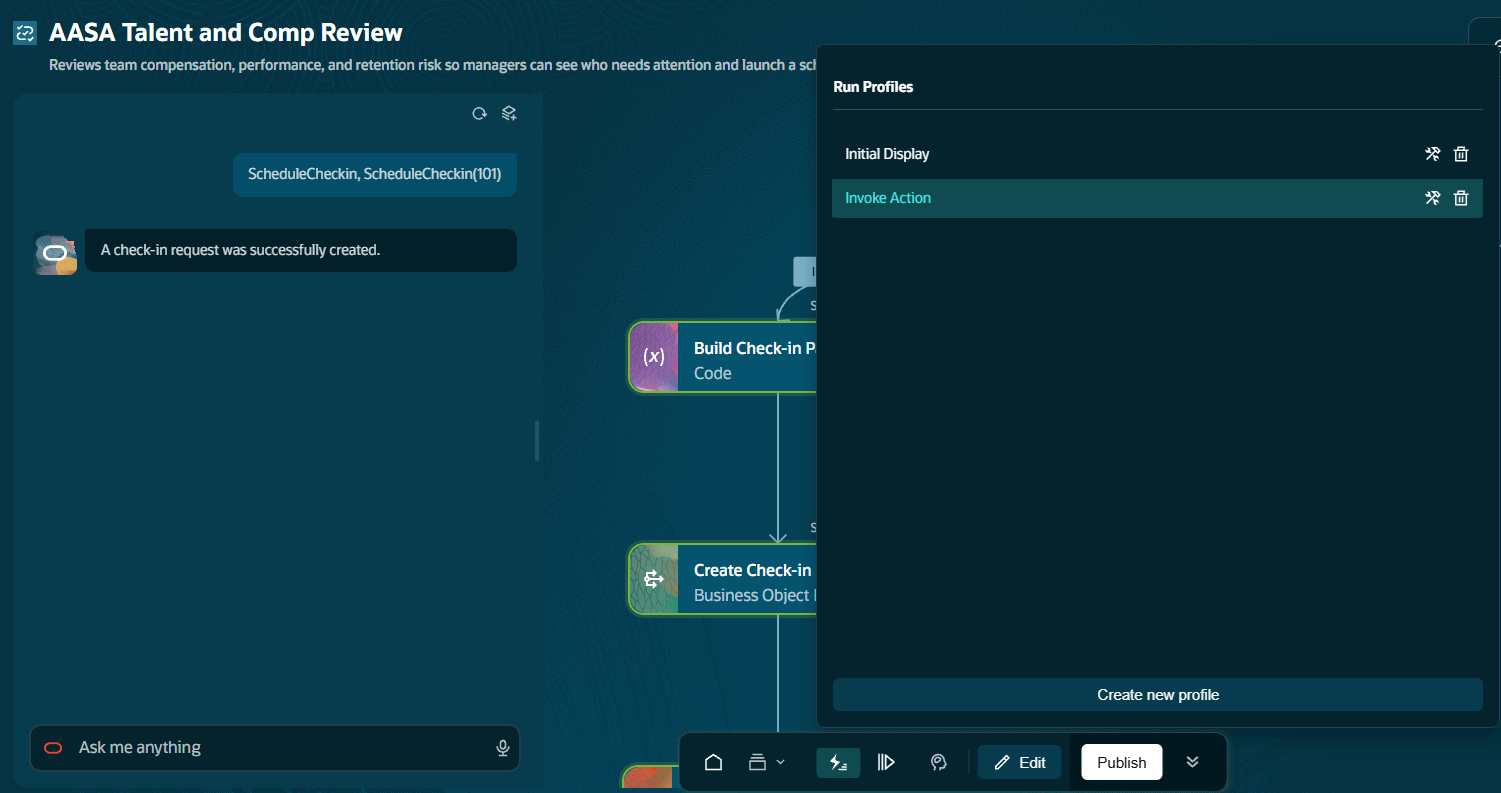
Oracle taught this with a deliberately broken node in Lab 2. A “Create Check-in Document” business object function returns a 400 response with five missing-value errors, so participants diagnose a real failure instead of stepping through a successful workflow. That deliberate fault is why the debugger exercise stayed with most of the room.
I would create the run profiles at the start of a build, before the publish-and-refresh loop has taken up a morning.
A Twenty-Minute Reproduction
You can reproduce the behaviour above on a pod you already use, without first building anything.
Open one of your own agentic apps and place the browser console beside it. The labs use a compliance app with four audit agents. Enter
turnOnDebugging()and confirm that the console replies “Agentic Apps debug mode enabled”.Refresh the page. The five startup hints should appear in sequence, each with the responding agent and elapsed time. Filter for “Summary” to see the
Partial Summaryconsolidation.Open the same agent in Workflows. Under Settings, then Details, find Expose to Agentic Apps. The adjacent fields capture estimated time and cost saved per run.
Open the message-hint Switch and inspect the case values. The panel shows the ten published hints. Also note that the visible part of the case expression begins
{{$context.$triggers.; the namespace ambiguity is discussed below.
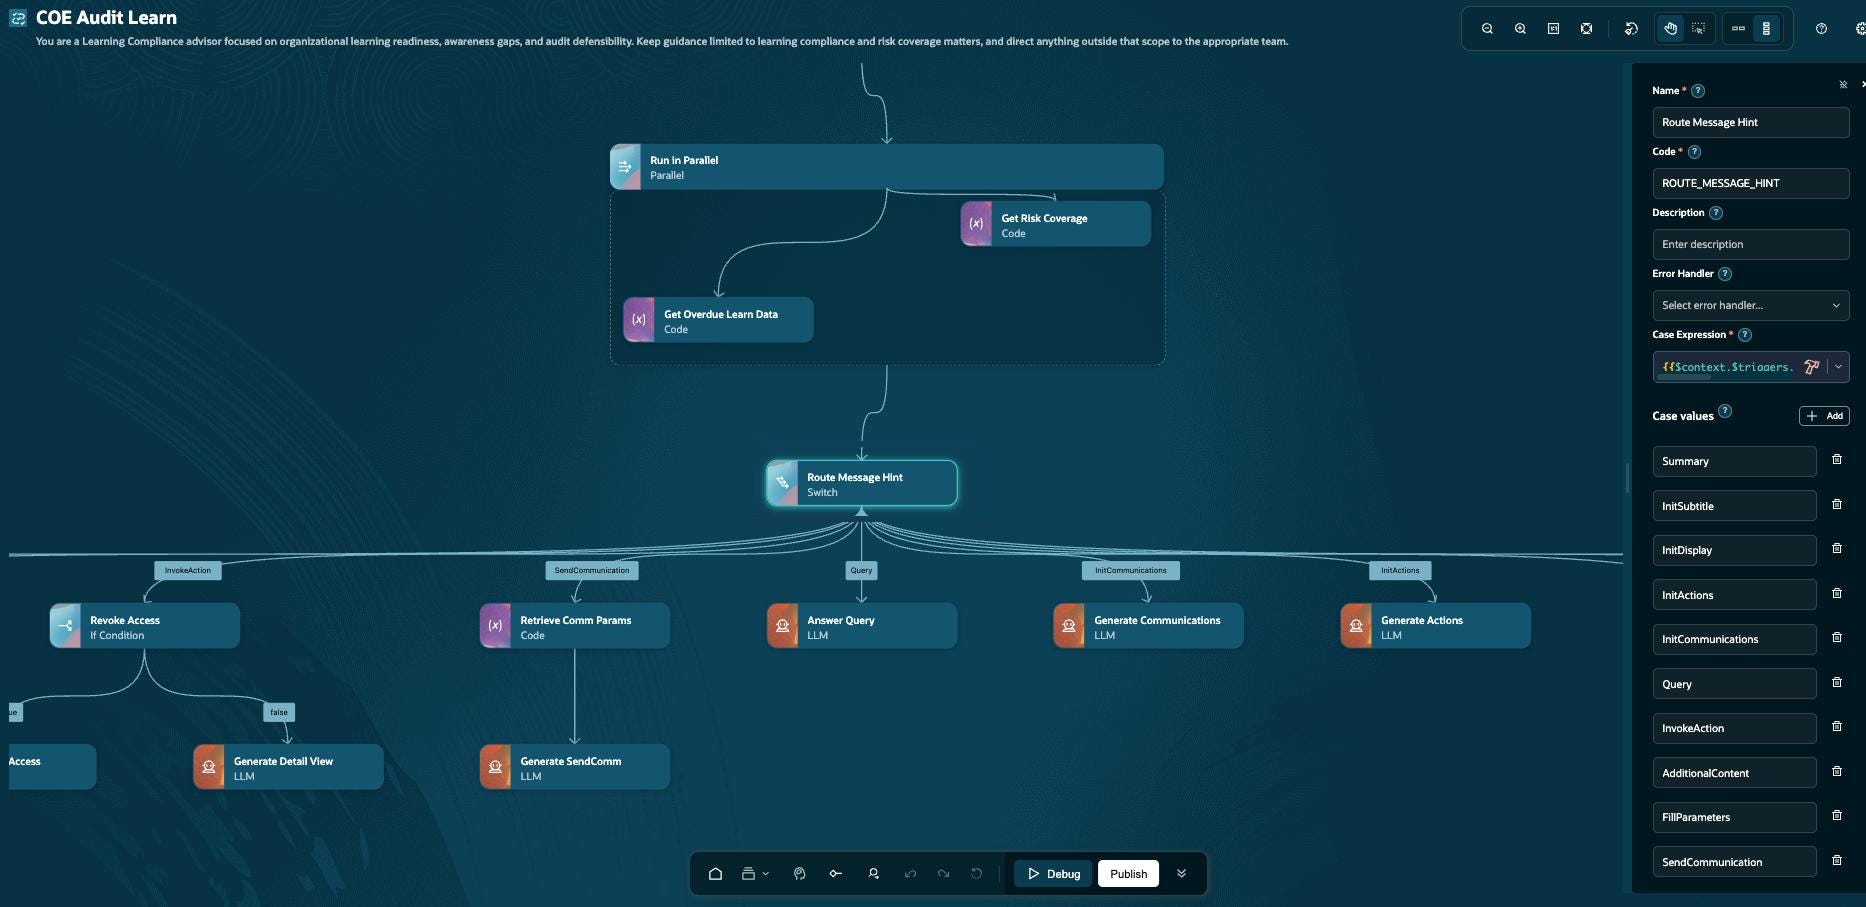
In Debug, create an Agentic App run profile in Initial Display mode. Run it to inspect the app output in the editor. Then add a breakpoint and step through it. Lab 2 uses the broken business object call described above, which is worth recreating simply to learn the debugger.
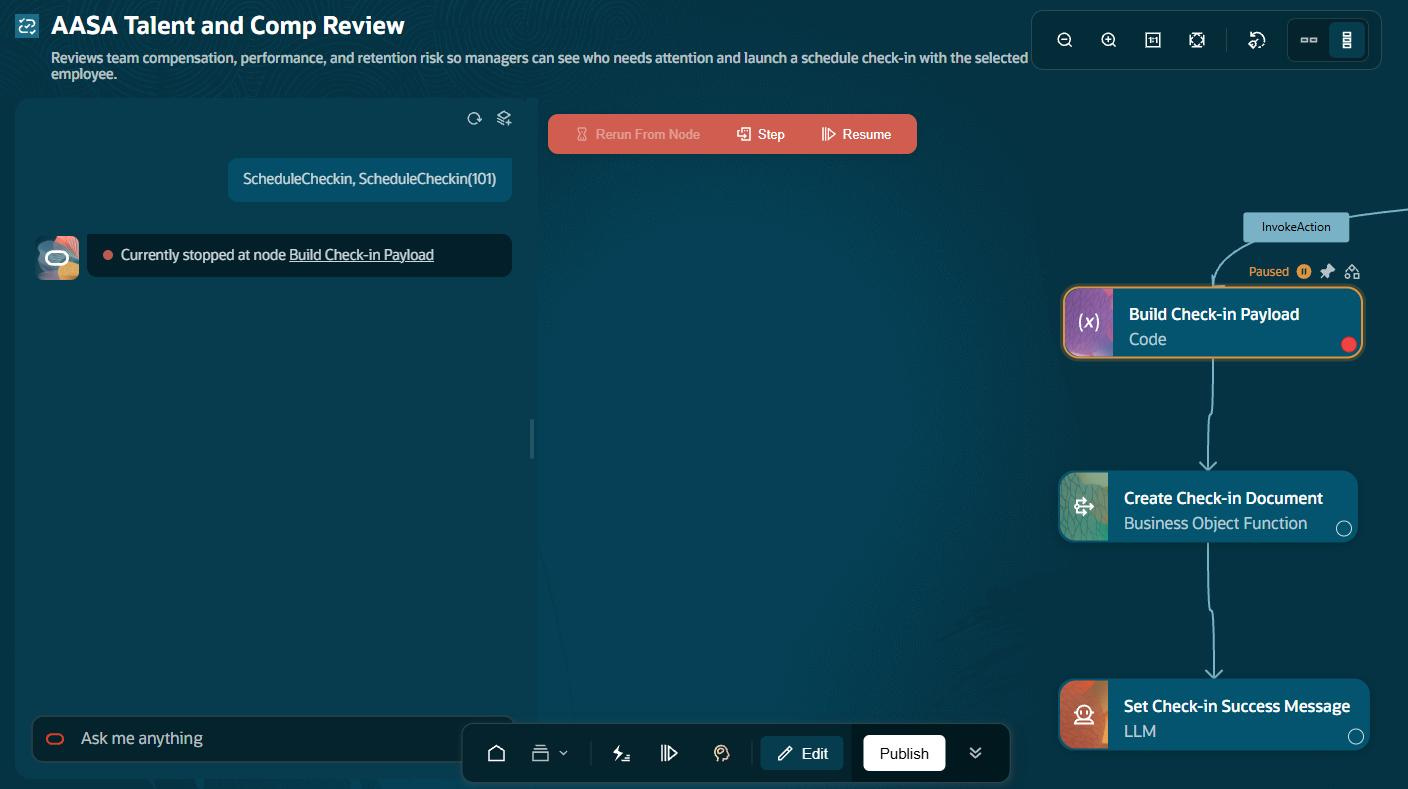
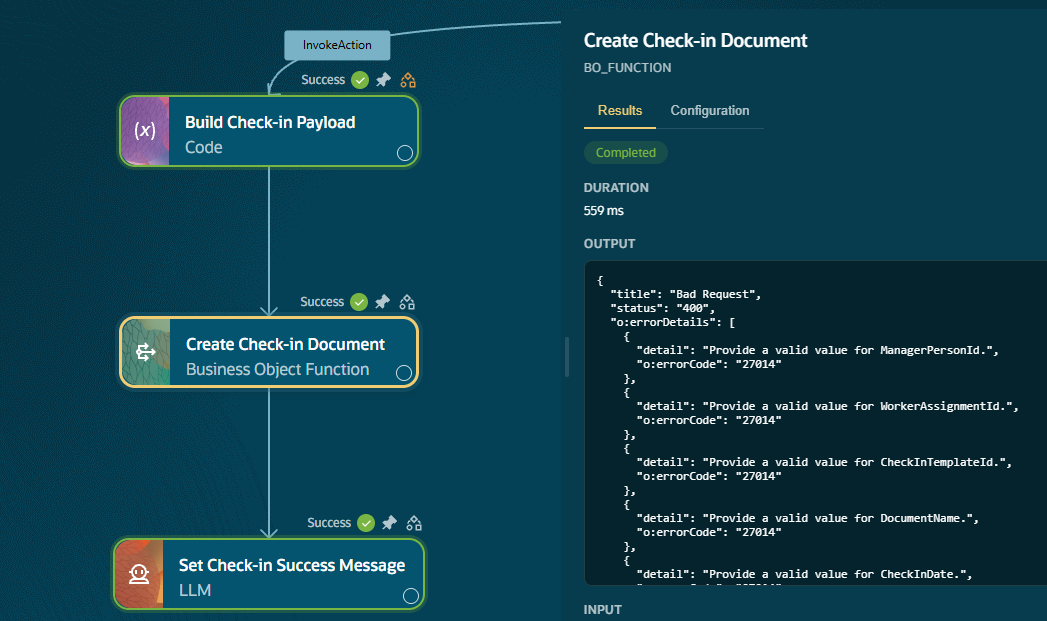
Doing this with your own agents on your own pod makes the execution model observable rather than something you have to accept from my account.
Where This Leaves You
The most useful model is to treat an agentic app as a rendering shell with a message contract. The logic, data access and security normally associated with a backend live in branches of a workflow agent, and that workflow starts at the top on every call.
For an architecture review, I would therefore focus on which agent handles each hint, what it can fetch and how many contributing agents the app runs on every open. The console gives you timings for that discussion instead of relying on impressions.
Sources: Oracle AI Agent Studio partner enablement, attended in person 17-19 August 2026. The claims, the judgements and any errors are mine. Views are my own, not my employer’s or Oracle’s.